Promotional Product Sales by State and Region (2025 Data)
Promotional Product Sales by State and Region (Latest 2025 Data)
The promotional products industry had another strong year in 2025, and the latest numbers show just how large the market has become across the United States.
- According to the Counselor 2026 State & Regional Sales Report from ASI Research, U.S. promotional product sales reached approximately $25.5 billion in 2025, representing 4.1% year-over-year growth.¹ The United States also accounted for approximately 92% of the $27.7 billion North American promotional products market.²
What I find especially interesting is how those sales are distributed around the country. The South alone generated more than $10 billion in promotional product sales, but the West actually posted the fastest percentage growth.
Here is a closer look at where businesses and organizations are spending their promotional product dollars.
U.S. Promotional Product Sales: $25.5 Billion, Up 4.1%
Before breaking down the individual regions, the national numbers provide some important perspective.
2025 U.S. promotional product sales: $25.5 billion
Year-over-year growth: 4.1%
That 4.1% increase was more than double the industry's growth rate from the previous year. However, ASI cautions that tariff-related price increases contributed to the increase in revenue. In other words, the growth figure should not necessarily be interpreted as a 4.1% increase in the number of promotional products purchased.¹
Still, the geographic breadth of the growth is encouraging. According to ASI, nearly 60% of states grew faster than the national 4.1% rate, and Maryland was the only state with an estimated decline in promotional product revenue.¹
Now let's look at each region.
South Promotional Product Sales: $10.5 Billion, Up 3.9%
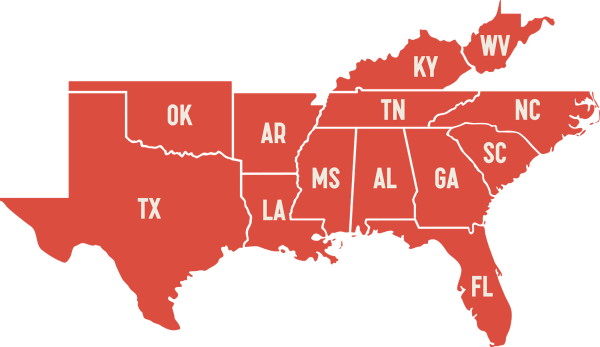
The South is unquestionably the heavyweight of the U.S. promotional products industry.
Southern states generated approximately $10.5 billion in promotional product sales during 2025, representing 3.9% growth. That means the South accounted for just over 41% of all U.S. promotional product sales.¹
Texas is a huge reason why.
At approximately $4 billion, Texas by itself generated more promotional product revenue than many entire regions could reasonably expect to produce. Florida followed with nearly $1.9 billion, while North Carolina and Georgia each surpassed $1 billion.
Here is the complete Southern breakdown by state with their sales and growth percentage year over year:
-Texas $4.0 billion +3.1%
-Florida $1.9 billion +4.6%
-North Carolina $1.1 billion +3.4%
-Georgia $1.1 billion +4.2%
-Tennessee $562.8 million +6.4%
-South Carolina $512.2 million +4.3%
-Oklahoma $284.3 million +3.4%
-Kentucky $257.3 million +6.8%
-Louisiana $239.8 million +2.1%
-Arkansas $205.6 million +3.3%
-Alabama $205.3 million +4.8%
-Mississippi $127.7 million 4.7%
-West Virginia $71.5 million +3.6%
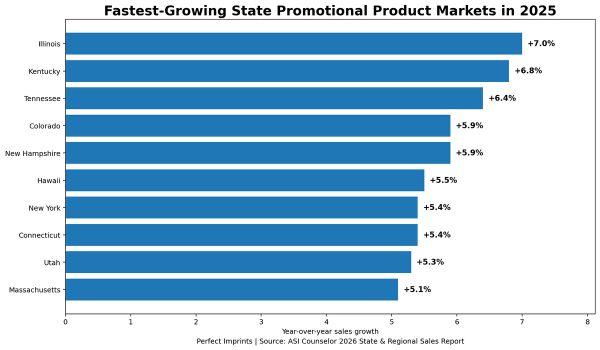
Kentucky and Tennessee are worth watching. Kentucky grew an impressive 6.8%, while Tennessee increased 6.4%, both significantly higher than the national growth rate.
Florida is another important story. With approximately $1.9 billion in promotional product sales, Florida grew 4.6%, also exceeding the national average.¹
For companies like Perfect Imprints that serve businesses throughout the South, these numbers reinforce just how important promotional products remain for companies, schools, nonprofits, healthcare organizations, tourism businesses and countless other organizations throughout the region.
West Promotional Product Sales: $5.7 Billion, Up 4.5%
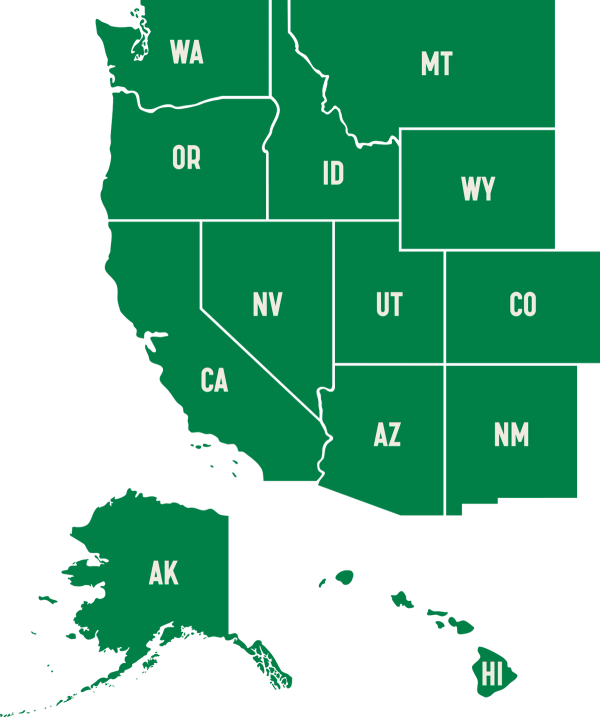
The West didn't generate the most promotional product revenue, but it grew faster than any other U.S. region in 2025.
Total sales reached approximately $5.7 billion, an increase of 4.5%.¹
California naturally leads the region, but several smaller Western markets posted impressive growth.
-California $1.8 billion +4.6%
-Washington $805.6 million +4.2%
-Colorado $733.7 million +5.9%
-Arizona $633.9 million +3.8%
-Utah $445.3 million +5.3%
-Oregon $412.2 million +3.8%
-Nevada $266.8 million +3.0%
-Idaho $228.2 million +4.2%
-New Mexico $121.7 million +2.3%
-Montana $103.2 million +4.2%
-Hawaii $72.8 million +5.5%
-Alaska $55.0 million +3.8%
-Wyoming $50.3 million +4.7%
California's $1.8 billion market grew 4.6%, slightly faster than the national industry.
Colorado was particularly strong, increasing 5.9% to approximately $733.7 million. Utah grew 5.3%, Hawaii grew 5.5%, and Wyoming increased 4.7%.¹
ASI points to factors such as Colorado's strong tourism economy and Utah's favorable economic outlook as possible contributors to the performance of those markets.¹
Northeast Promotional Product Sales: $4.7 Billion, Up 4.3%
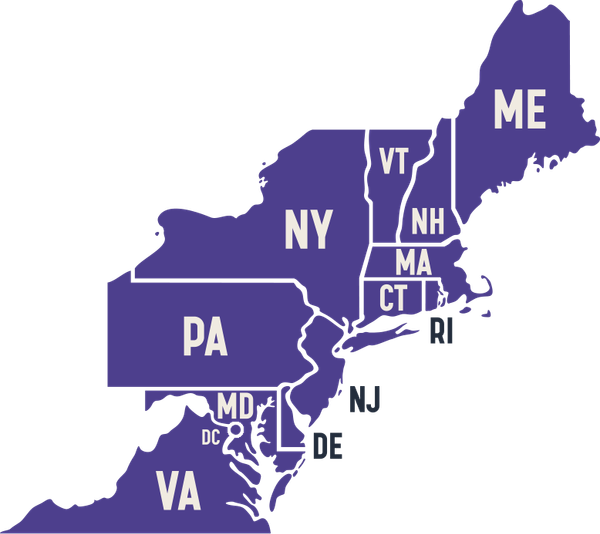
The Northeast generated approximately $4.7 billion in promotional product sales, growing 4.3% in 2025.
That made it the second fastest-growing region in the country, trailing only the West.¹
New York remained the largest promotional products market in the region and came very close to crossing the $1 billion mark.
-New York $984.7 million +5.4%
-Virginia $837.4 million +3.8%
-Pennsylvania $819.5 million +4.3%
-Massachusetts $551.7 million +5.1%
-New Jersey $535.4 million +5.0%
-Maryland $360.5 million -1.5%
-Connecticut $214.0 million +5.4%
-New Hampshire $110.1 million +5.9%
-Maine $88.9 million +4.5%
-Delaware $80.3 million +4.3%
-Rhode Island $62.8 million +4.7%
-Vermont $46.0 million +4.5%
-District of Columbia $44.9 million +4.5%
New York's market grew 5.4%, bringing annual promotional product sales to nearly $985 million.
Massachusetts increased 5.1%, New Jersey grew 5.0%, Connecticut increased 5.4%, and New Hampshire led the region in percentage growth at 5.9%.¹
Maryland stands out for a very different reason. Its estimated promotional product sales fell 1.5%, making it the only state in the country to record a decline.
ASI connects Maryland's weakness to federal government job reductions during 2025 and contraction in the state's GDP.¹
Midwest Promotional Product Sales: $4.6 Billion, Up 4.1%
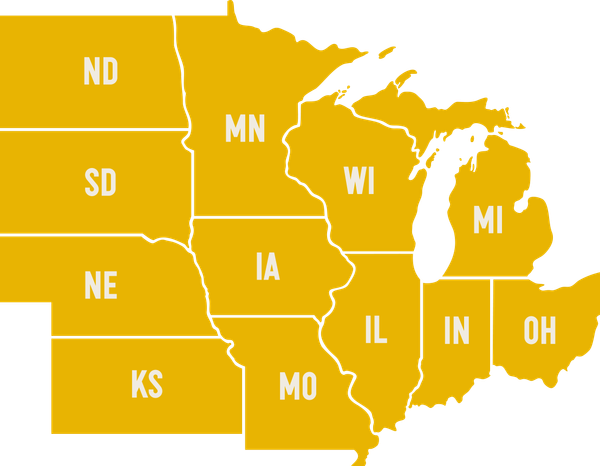
The Midwest generated approximately $4.6 billion in promotional product sales during 2025, increasing 4.1%.
That puts the region almost exactly in line with the national growth rate.¹
The real headline, however, is Illinois.
-Ohio $714.8 million +3.4%
-Illinois $623.5 million +7.0%
-Michigan $532.1 million +3.7%
-Indiana $526.5 million +4.3%
-Minnesota $477.7 million +3.8%
-Missouri $396.9 million +1.8%
-Wisconsin $386.8 million +4.5%
-Iowa $270.2 million +3.9%
-Kansas $213.3 million +4.1%
-Nebraska $194.6 million +3.5%
-North Dakota $92.2 million +3.6%
-South Dakota $86.8 million +4.5%
Illinois promotional product sales increased 7.0%, the largest percentage increase of any state in the country.
ASI notes that Illinois experienced record tourism spending during 2025 along with increased investment in manufacturing, pharmaceuticals and other sectors. Those economic developments likely helped support promotional product demand.¹
At the opposite end was Missouri, where promotional product revenue increased only 1.8%. ASI notes that severe weather and tornadoes may have contributed to the state's weaker economic performance.¹
Most of the remaining Midwest states were remarkably consistent, generally landing close to the national growth rate.
Which Region Buys the Most Promotional Products?
Putting all four regions together makes the scale much easier to see:
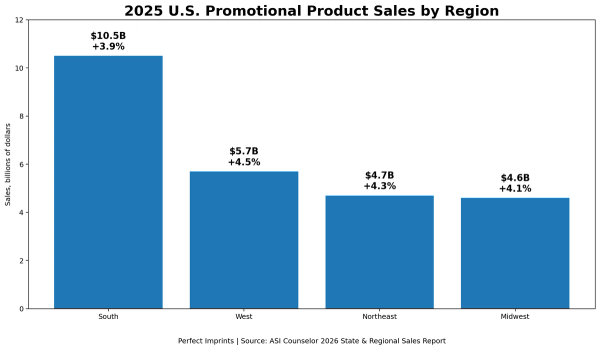
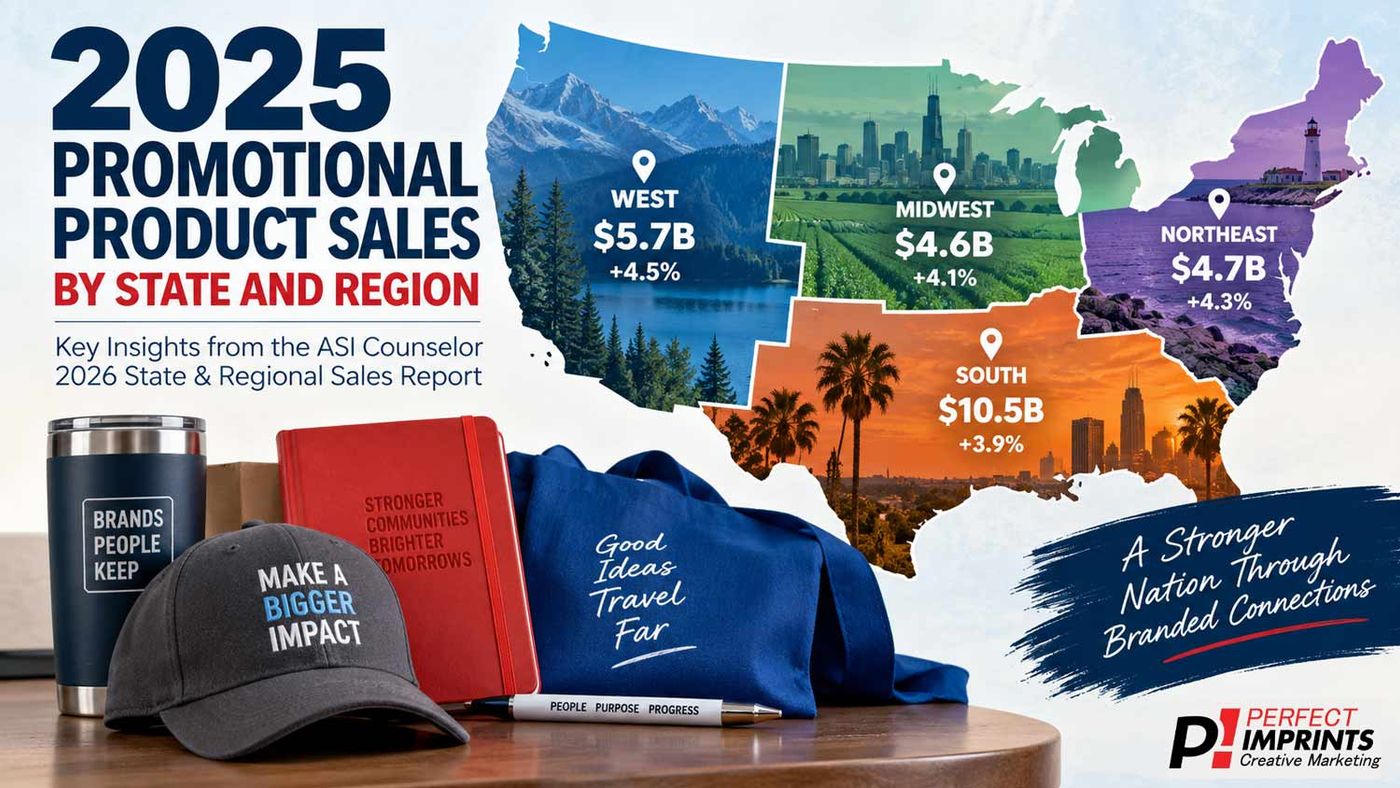
South $10.5 billion +3.9%
West $5.7 billion +4.5%
Northeast $4.7 billion +4.3%
Midwest $4.6 billion +4.1%
United States $25.5 billion +4.1%
The South represents roughly 41% of the entire U.S. promotional products market, making it the clear leader in total sales. The West, however, earned the growth crown with its 4.5% increase.
And there is another interesting point for marketers: every region grew in 2025.
That matters because promotional products aren't a niche advertising strategy confined to one part of the country. Businesses and organizations from California to Florida and New York to Illinois collectively spent more than $25 billion on branded merchandise in a single year.
The Fastest Growing States in the Promotional Products Market
What Are Consumers in Different Regions Looking For?
Sales numbers tell us where the money is being spent, but separate ASI consumer research provides some clues about what people in those regions actually want to receive.
ASI found regional differences in preferred promotional products. Consumers in the West showed preferences for tech accessories, desk accessories and stickers/lanyards. Midwestern consumers favored T-shirts, polos and drinkware. In the Northeast, drinkware, hats and bags performed well, while consumers in the South favored outerwear/fleece, polos and T-shirts.²
There is also an important lesson that applies across every region: quality and usefulness matter.
Depending on the region, between 60% and 66% of consumers cited quality as a primary reason for keeping a promotional product, while between 55% and 62% cited utility.²
That is something we talk about frequently at Perfect Imprints. The goal shouldn't simply be to distribute the greatest number of promotional products possible. The goal should be to choose products people actually want to keep and use.
Promotional Products Remain a $25.5 Billion Advertising Medium
The biggest takeaway from the 2026 State & Regional Sales Report isn't necessarily which state finished first or which region grew fastest.
It is the sheer size and geographic diversity of the industry.
Businesses and organizations spent approximately $25.5 billion on promotional products in the United States during 2025, and sales increased across the South, West, Northeast and Midwest.¹
Whether you are building a nationwide promotional campaign or targeting customers in one local market, those numbers reinforce the continued role tangible branded merchandise plays in American marketing.
At Perfect Imprints, we help businesses and organizations choose promotional products that people will actually use, rather than items that simply add another logo to the world. The right product, matched with the right audience and campaign, can keep your organization visible long after the initial handout.
References
1. Rosenberger, Hannah. Counselor 2026 State & Regional Sales Report. Advertising Specialty Institute, September 2, 2026.
ASI Counselor 2026 State & Regional Sales Report
2. ASI Research. Consumer Research: What Do Different Regions Want in Promo? Advertising Specialty Institute, 2026.
ASI Regional Consumer Research
Need Help Ordering Promotional Products For Your Organization?
Our team can help you pick the right product, decoration, and quantity for your project. Reach out and we’ll send tailored ideas — usually within one business day.
See Related Blogs About Promotional Products Research
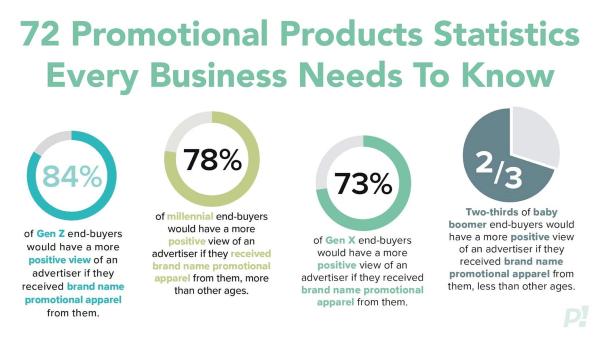
72 Promotional Products Statistics Every Business Needs To Know (2025+ Data)
If you want your marketing dollars to work harder, you need to understand what actually influences your audience. The latest research from 2025 and newer studies shows that promotional products are…

How to Choose Promotional Items People Actually Keep and Use
In this video, we break down the top 5 promotional products people actually keep and use based on real consumer research. Learn how focusing on everyday items like apparel, bags, drinkware, and more c…
The 5-Second Impact: Why Promotional Products Win or Lose Almost Instantly
When someone receives a promotional item, the decision happens fast. According to new PPAI consumer research, a promotional product has about five seconds to earn a place in someone’s life or end up f…
What Makes Promotional Products Feel Premium, or Forgettable in 2026 and beyond? New Research Reveals.
For years, promotional products were judged differently from retail items. That is no longer the case. According to new PPAI consumer research, today’s consumers evaluate promotional products using th…
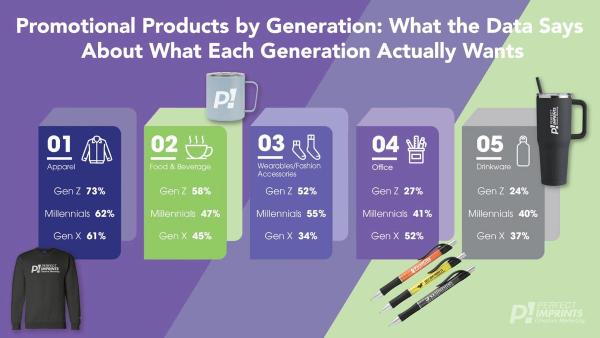
Promotional Products by Generation: What the Data Says About What Each Generation Actually Want
If you are choosing promotional products based on guesswork, you are leaving results on the table. The best promotional strategies are built around one simple idea. Give people what they actually want…
What Are the Best Promotional Gifts for Women?
Make sure you're buying promotional gifts that women actually want. See the top promotional items here based on research.
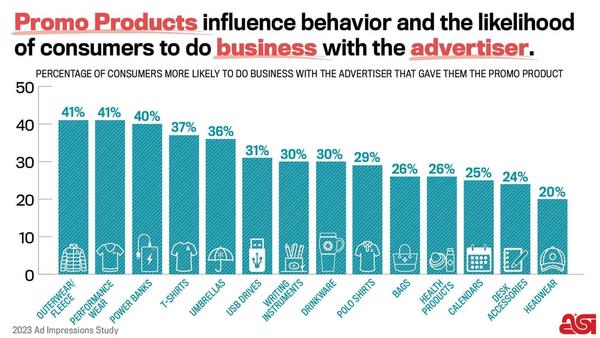
Do Promotional Products Increase The Likelihood of Consumers Doing Business With You?
Promotional products are not just about brand awareness. They directly influence whether someone chooses to do business with you. According to the 2023 Ad Impressions Study by the Advertising Spec…